

But across England, fewer than one in 14 new Covid cases are among the at-risk 60 and over age group, with people under 30 accounting for half of all cases in the seven days to May 11.
But is it the same picture in Calderdale?
We have crunched the latest numbers from the UK government coronavirus dashboard to reveal which age groups are seeing the highest number of cases.
The figures refer to the total number of cases, not the rate per head of the population.
Here are the 10 age groups in the borough that had the highest infection rates in the seven days to May 11.
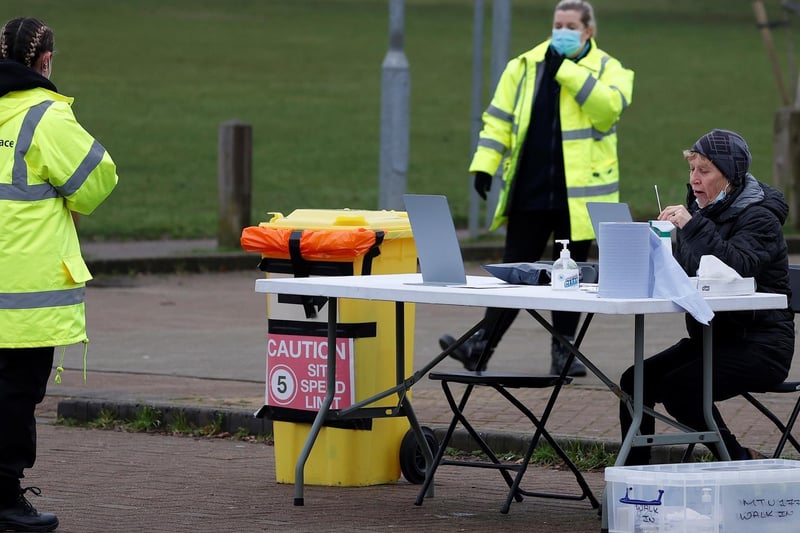
1. 25-29
People aged 25-29 accounted for the highest number of cases between 5 and 11 May, with 10, or 14.5% of the total. Photo: ADRIAN DENNIS/AFP via Getty Images
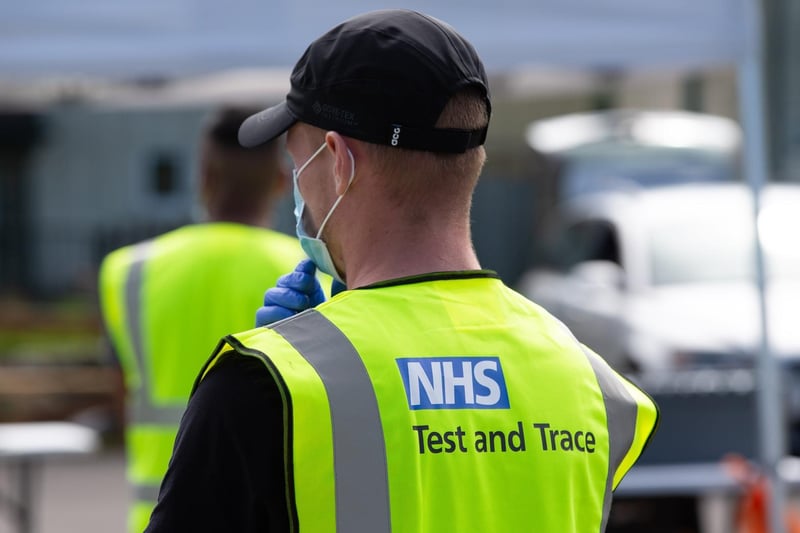
2. 35-39
People aged 35-39 accounted for the highest number of cases between 5 and 11 May, with 8, or 11.6% of the total.
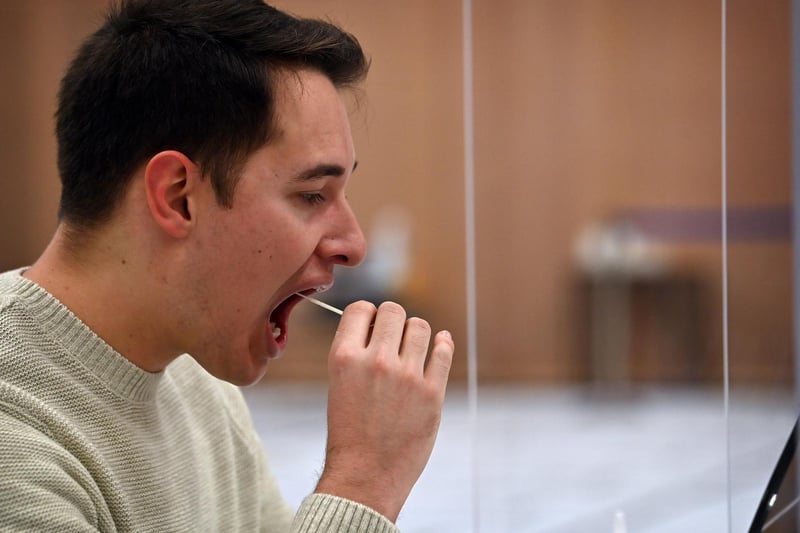
3. 10-14
People aged 10-14 accounted for the highest number of cases between 5 and 11 May, with 8, or 11.6% of the total. Photo: PAUL ELLIS/AFP via Getty Images

4. 30-34
People aged 30-34 accounted for the highest number of cases between 5 and 11 May, with 8, or 11.6% of the total. Photo: PAUL ELLIS/AFP via Getty Images